1 OVERVIEW OF USER GUIDE
This guide describes the general concepts how to the use the Web Interface of the GhEA Tool Kit for Energy Policy and Planning. It provides an overview of the functions of the interface.
The GhEA toolkit is organized into six broad modules (Figure 1)
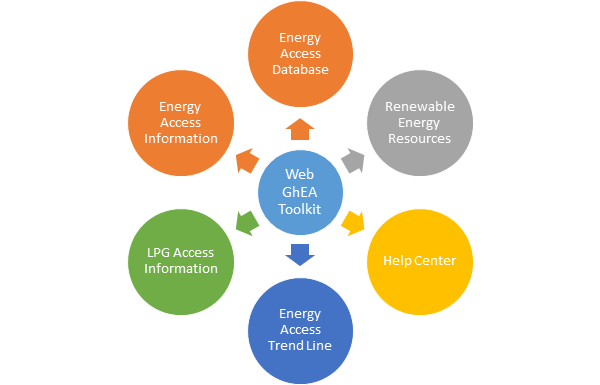
Figure 1: General Structure on the Web Interface for the GhEA Toolkit
2 Home Page
![]()
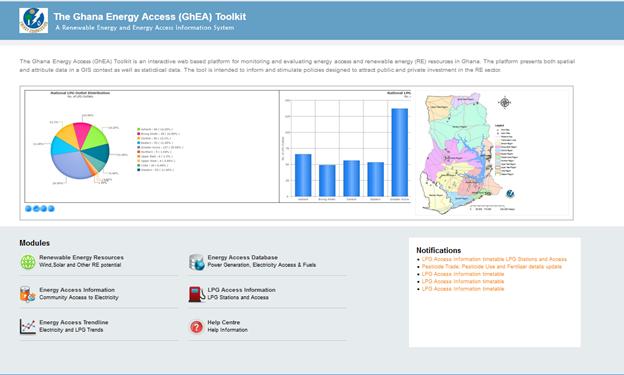
Figure 2: Home Page of the Web Interface of the GhEA Toolkit
2.1 Overview
The Toolkit has been developed to be as user friendly as possible and was developed with a Client – Server architecture. It has been designed to enable multiple access to the various tools enabling the user to use as many tools (or all) as required simultaneously.
The Home
is the start page of the Web interface and can also be reached from
anywhere in the tool by clicking the HOME
(![]() ) icon to
the left of the banner of all the module pages. At the homepage the
slide show displays highlights some the key information that can be
obtained from the toolkit.
) icon to
the left of the banner of all the module pages. At the homepage the
slide show displays highlights some the key information that can be
obtained from the toolkit.
2.2 Accessing the Modules
Below the Slideshow are the six broad modules that have been used to organize the data in the toolkit.
To access the information contained in any of the modules, the user has to click on the module to open the page.
2.3 Notifications
The Notifications sections displays notifications for all the six modules and another that the system administrator wants to pass on to the users of the toolkit.
3 Renewable Energy Resources MOdule
To access this module the user has to click on the module highlighted in Figure 2. This will open the Renewable Energy Resources module (Figure 3). The information in this module is organized under these broad themes categorized as;
Ø RE Resources (Figure 4)
Ø Livestock Waste & Crop Residue (Figure 5)
Ø Hydro Sites (Video) (Figure 6)
Ø Tidal Data (Figure 7)
The information under each of these key thematic area is shown when that tab or link on the left is clicked (Figure 3).
The RE Resources section is GIS based and allows the user to carry out limited GIS related operations. Layers can be turned on or off, Buffering can be carried out, attributes of features can be viewed when they are selected, distance between mapped features can be measured. These functionalities are applicable to all the GIS sections of the toolkit.
For the other sections which are non GIS based the information in the tables are searchable using the search functionality based on the fields of the tables and the data meeting only the search criteria will be shown. The information is also sortable by clicking on the respective column that the sorting is required. The data in these tables can be exported into excel for further processing. These functionalities are applicable to all the non GIS sections of the toolkit.
![]()

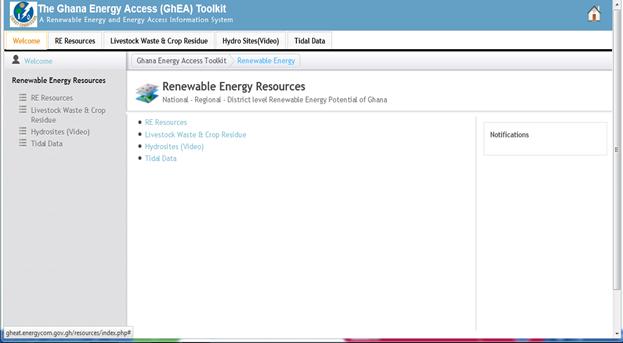
Figure 3: The Toolkit showing the Renewable Energy Resources section
3.1 RE Resources
This section gives information on the RE Resources in Ghana. This section is GIS based and operations such as Buffering and measure can be carried. Information is avilable for energy maps and Transmission line:
The turn on or off any of the layers click on the plus (+) by the category folders to expand the layers for that category. The tools at the side and top of the display window of the map can be used to manipulate the maps to suit the users preference.
![]()

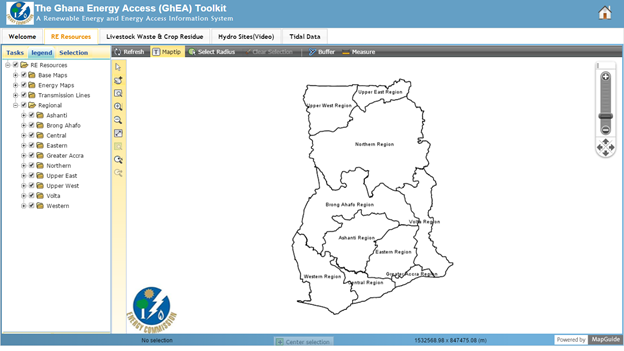
Figure 4: Screenshot of Maps page for RE Resources
3.2 Livestock & Crop Residue
This section gives information on Livestock and crop residue in a tabular form. Data can be exported into excel for further processing. Table columns are sortable and table can also be searched based on the columns. To view any of the information on the sub-categories for Livestock and Crop residue Simply Click on the Lin in the Left Menu (Figure 5)

![]()
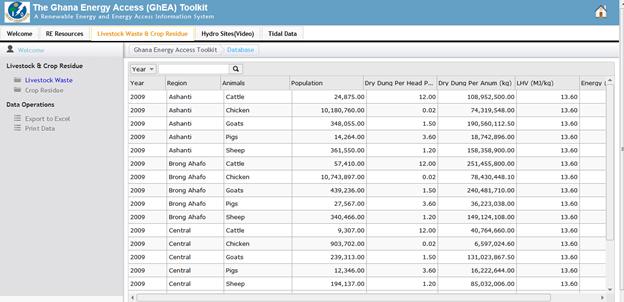
Figure 5: Screenshot of Livestock & Crop Residue Page
3.3 Hydro Sites (Video)
This pages gives information of short videos on potential small and medium hydro sites. To play any of the videos simply click on the video to the left menu bar (Figure 6).

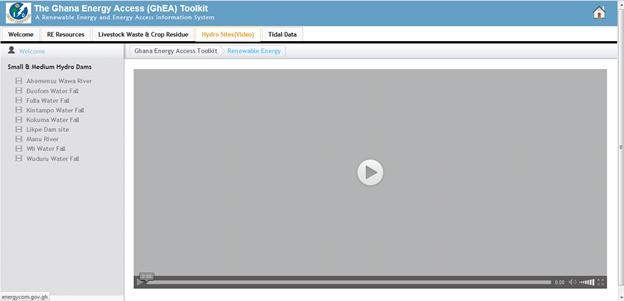
Figure 6: Screenshot of Small & Medium Hydro Sites
3.4 Tidal Data
Key parameters on tidal information for renewable energy development can be obtained in this section.
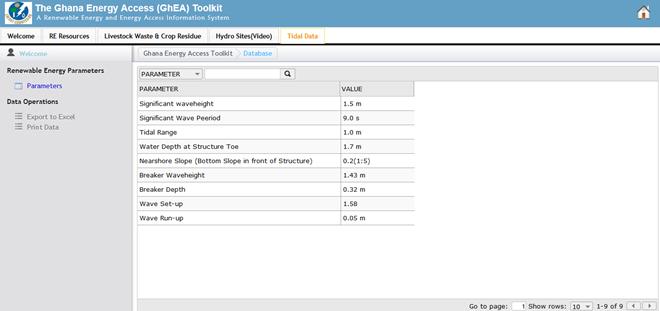
Figure 7: Screenshot of Tidal Data Page
4 Energy Access Database
This section gives information on Solar Facilities, Power Generation, Household Fuels, Electrified Communities, ECG Customers, Petroleum fuels and Communities Coordinates.
![]()

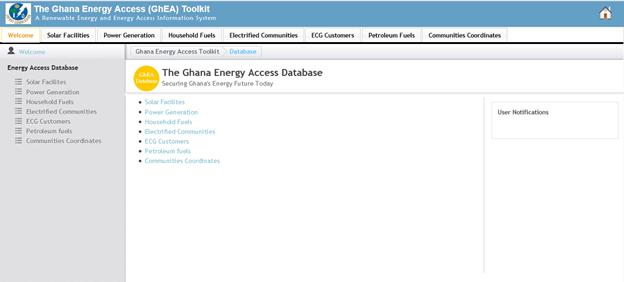
Figure 8: Home Page of the Energy Access Database
4.1 Solar Facilities
This section gives information on Solar Power Facilities categorized into Grid Connected and Others in a tabular form. Data can be exported into excel for further processing. Table columns are sortable and table can also be searched based on the columns (Figure 9).
![]()

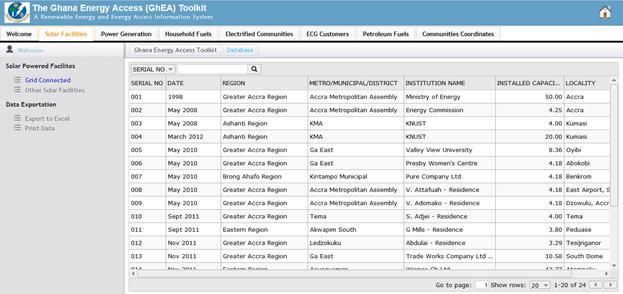
Figure 9: Screenshot of Solar Facilities Pages
4.2 Power Genration
This section gives information on Power Generation Mix in the country in a tabular form. Data can be exported into excel for further processing. Table columns are sortable and table can also be searched based on the columns
![]()

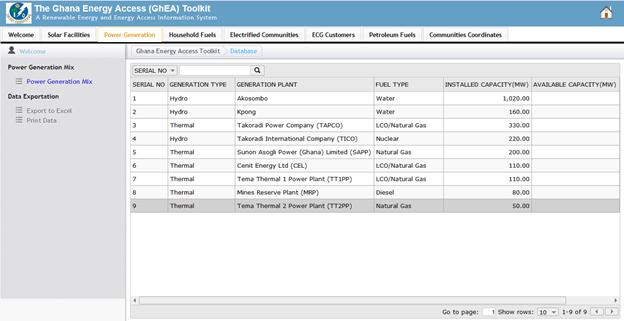
Figure 10: Screenshot of Power Generation Mix Page
4.3 Household Fuels
This section gives information on Household Fuels Categorized into Lighting and Cooking Fuels in a tabular form. Data can be exported into excel for further processing. Table columns are sortable and table can also be searched based on the columns. The data has also been presented in a pie chart format. Based on the option selected and can also be shown per region or for the whole country.

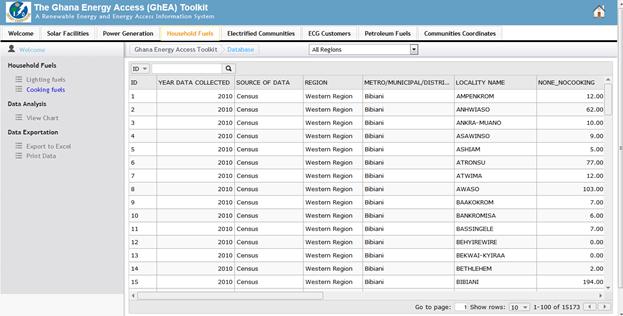
Figure 11: Screenshot of Household Fuels Page
![]()

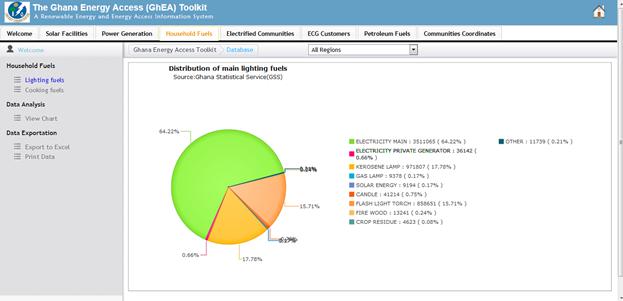
Figure 12: Screen Shot of Pie Chat for Main Lightning Fuels
![]()

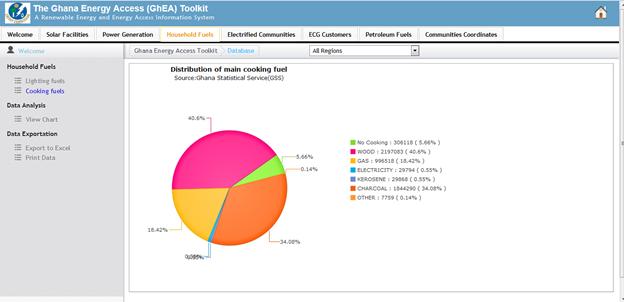
Figure 13: Screen Shot of Pie Chat for Main Cooking Fuels
4.4 Electrified Communities
This section gives information on Electrified Communities Categorized into Northern and Southern Sectors in a tabular form. Data can be exported into excel for further processing. Table columns are sortable and table can also be searched based on the columns.
![]()

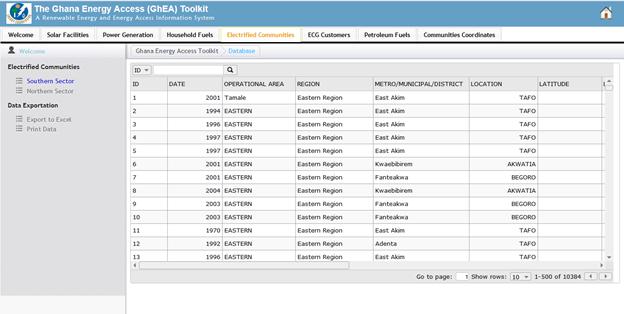
Figure 14: Screenshot of Electrified Communities Page
4.5 ECG Customers
This section gives information on Number of ECG customers for the Southern Sectors in a tabular form. Data can be exported into excel for further processing. Table columns are sortable and table can also be searched based on the columns.
![]()

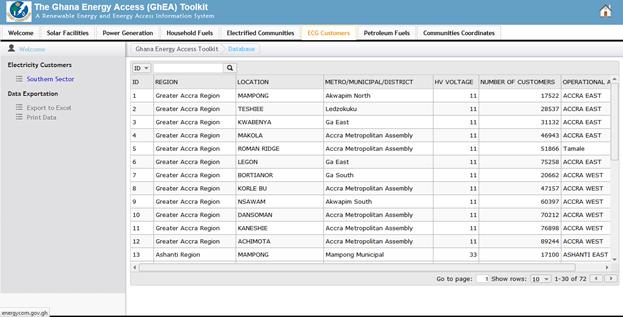
Figure 15: Screenshot of ECG Customers Page
4.6 Petroleum Fuels
This section gives information on Petroleum Fuels Categorized into LPG and Liquid Fuel Stations in a tabular form. Data can be exported into excel for further processing. Table columns are sortable and table can also be searched based on the columns.
![]()

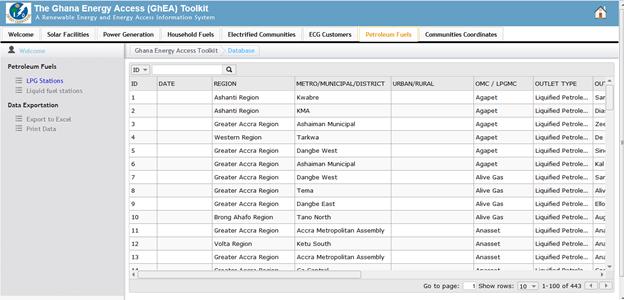
Figure 16: Screenshot of Petroleum Fuels Page
4.7 Community Coordinates
This section gives information on the GPS coordinates on Communities a tabular form. Data can be exported into excel for further processing. Table columns are sortable and table can also be searched based on the columns.
![]()

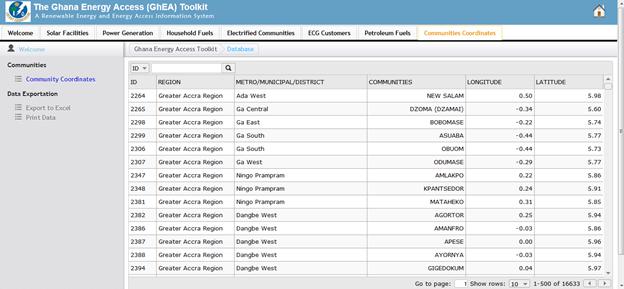
Figure 17: Screenshot of Coordinates of Communities
5 Energy Access Information
This is the Homepage of the Electricity Access Information
![]()
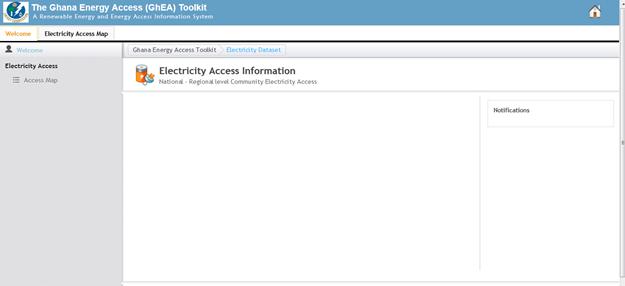
Figure 18: Screenshot of Energy Access Information Home Page
5.1 Electricity Access Maps
This section gives you information on the Electricity Access in Ghana. The communities have been categorized into electrified and un-electrified. This section is GIS based and operations such as Buffering and measure can be carried. The attributes for each of the communities can be viewed by selecting the communities with the map tools.
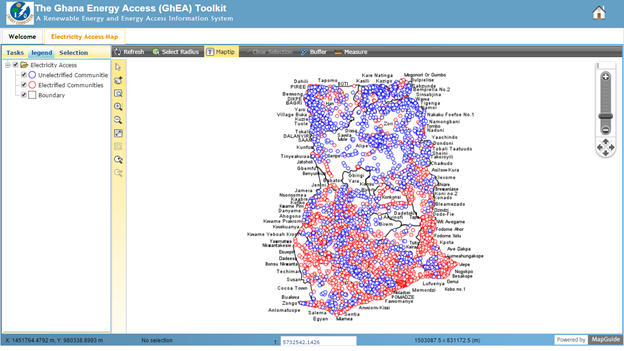
Figure 19: Screenshot of Electricity Access Map

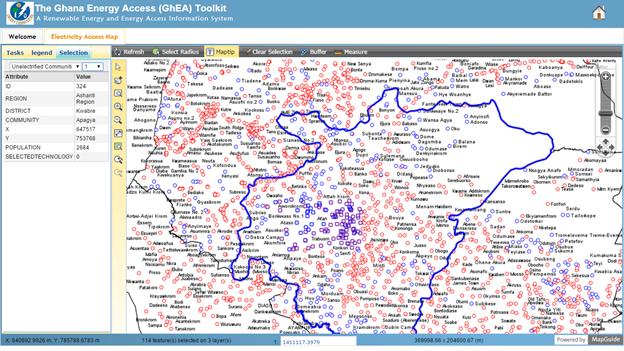
Figure 20: Electricity Access Map (zoom with attribute table)
6 LPG Access Information
![]()
Figure 21: Screenshot of Home Page of LPG Access Information
6.1 LPG Access Maps
This section gives you information on the LPG Stations in Ghana. This section is GIS based and operations such as Buffering and measure can be carried. The attributes for each of the stations can be viewed by selecting them with the map tools.
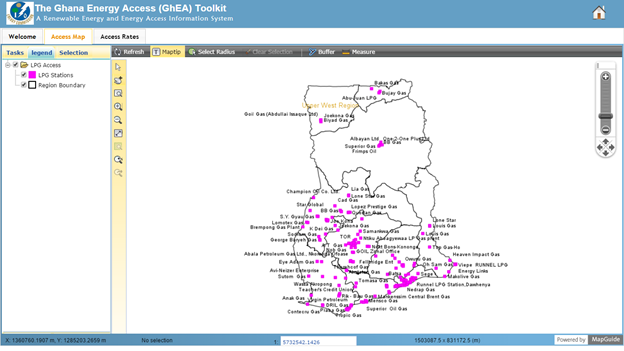
Figure 22: Screenshot of LPG Access Map
6.2 LPG Access Rates
This Sections shows information on the LPG Access rates in Ghana in a Pie or Bar chart format. The plotted chart can also be exported as a jpeg file.

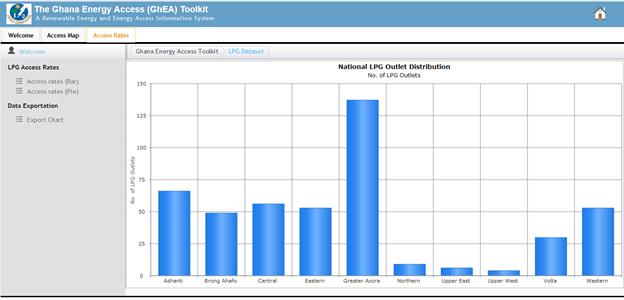
Figure 23: Screenshot of LPG Outlet Distribution per Region
7 Energy Access Trend Line
This sections shows information on the Electricity and LPG trend lines for the country and the regions.
![]()
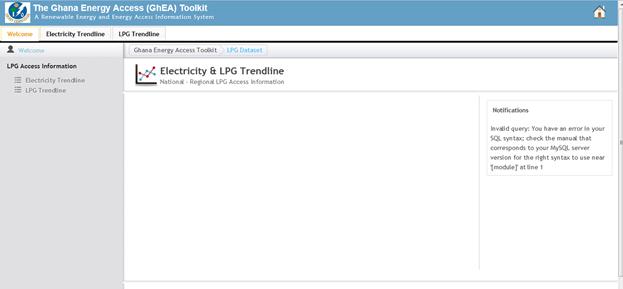
Figure 24: Screenshot of the Home Page of Electricity & LPG Trend Line
7.1 Electricity Trendline
This page shows the Electricity Access information for the regions and a chart showing the projections. The chart can be plotted for the whole nation and also for each of the regions. The toolkit allows you to export the chart.
![]()
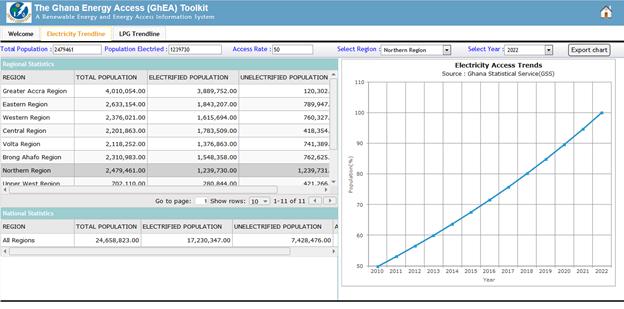
Figure 25: Screenshot of Electricity Trend Line for a Selected Region
7.2 LPG Trend Line
This page shows the LPG Access information for the regions and a chart showing the projections. The chart can be plotted for the whole nation and also for each of the regions. The toolkit allows you to export the chart.
![]()
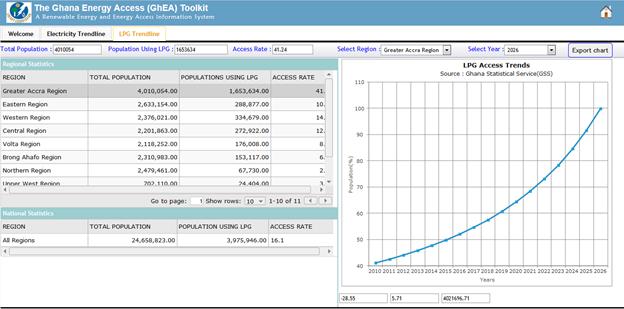
Figure 26: Screenshot of LPG Trend Line for a Selected Region